Marketing Statistics For The Busy Marketer
There are times you may find your yourself writing or reading about something, while you’re not sure if this is a feeling or a true piece of evidence. On other times, you might want to backup some data you write or read about with a real statistics and numbers.
Well, this sheet can help you do that. I sometimes call them facts, but Statistics is the more appropriate word.
Statistics is the study of the collection, analysis, interpretation, presentation, and organization of data.
It’s not only for marketers, but also for every website owner who looks for more solid statistics and studies on how to improve his website.
The main motivation for writing this post came from Quora. while answering on people questions, I found myself trying to provide some evidence to my answers rather than a Gut feeling. There are several challenges in writing such article, here are few I had to face: First, not making it boring with only facts (even if useful), second- how not to fully copy others data, Third- finding those Statistics , Forth- how relevant the Statistics are ?, Fifth- are they reliable Statistics ?
So, I tried to do my best. I made Statistics combined with my insights, second I tried to write it differently, third sourced all Statistics my self (around 30 sources), four & five- on each fact I wrote, I was looking for more than one (if exist) and adding the year the post was published.
Some Statistics are not from the last year or two, but they are still good and can give you data relevant for today marketing world. I know hubspot has large and big marketing statistics page,I was not trying to do the same. the truth is, I didn’t looked at it even once during my writing- and all were collected by searching data from the network. Also, I was not looking to cover all statistics and surely missed a lot.
So,use it in the way you think and enjoy reading!
SEO
Search
Headlines
Social
Mobile
Optimal Lengths
Other Data
SEO
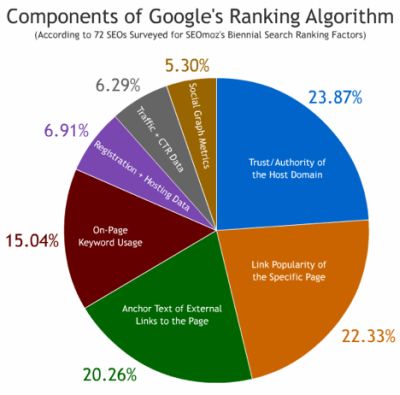
- 1) The trust and authority of your domain are counted for 23.87% From Google’s ranking algorithm components.
It was found to be largest indicator of SEO success [16,17] - 2) In the ranking component, Link building for page is with weight of 22.33% [16,17]
- 3) The anchor text of external links to the page has a weight of 20.26% In the Google’s ranking algorithm [16,17]
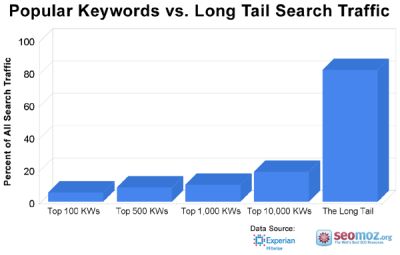
- 4) Long-tail keywords are around 80% of Moz’s organic traffic compared to other popular keywords [18]
- 5) Companies who actively blog on a regular basis have 434% more indexed pages which translates into more leads [2]
- 6) Around 90% of customers said that reading reviews, influence their buy decision [19]
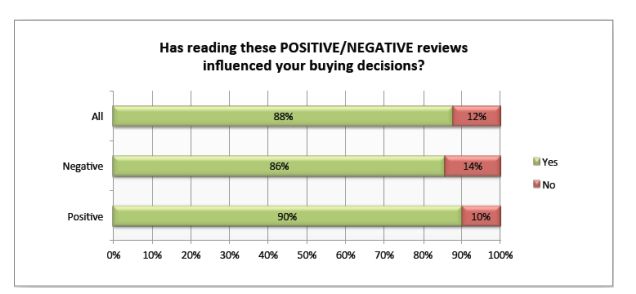
- 7) No. 1 factor influencing a buyer before price, is how much he trusts a company [19]
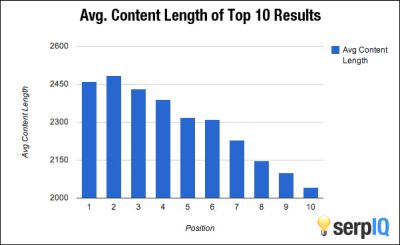
- 8) According to serpIQ, pages that ranks in Google’s top 10 results, has average content length of at least 2,000 words [28,29]
- 9) From moz analysis of their blog, Content rich sites get more links [29]
- 10) From Neil patel experiments on 327 blog posts, long content gets more tweets and Facebook likes. Posts greater than 1,500 words received on average 68.1% more tweets and 22.6% more likes compare to shorter posts under 1,500 words [29]
- 11) Firms with blog generated 126% more leads than those without a blog [26]
- 12) YouTube has become the second Largest Search Engine after google[30]
- 13) The number of hours people are watching on YouTube each month is up 50% year over year [30]
More benefits for long content
It’s good idea to write long and rich articles. They naturally include more keywords and cover more fields and google love them. They also have chance to feature as In-depth articles.
Here what Googles recommend you to do,in order to Optimize your site for the “In-depth articles” :
• Add Schema.org Article markup
• For multi-part content, use pagination markup by adding rel=next and rel=prev
• Add logo from Google+ Page or by suing organization markup
• For subscription-based access, implement First Click Free to enable Google’s search crawler’s access to your content
It might take time until you see logo changes in search results.
TOP
Search
- 1) 91% of US Internet users search every month [1]
- 2) The top 5 results get 75% of the clicks [1]
- 3) 93% of online experiences begin with a search engine [2]
- 4) The top listing in Google’s organic search receives 33% of the traffic [2,27]
- 5) The Top 3 search results in google, are getting more than 60% of the clicks [27]
- 6) 70 to 80% of users ignore paid ads, while focusing on the organic results [3]
- 7) 75% of users never scroll past the first page of search results [3]
- 8) For Google, 18% of organic clicks go to the #1 position, 10% of organic clicks go to the #2 position and 7% of organic clicks go to the #3 position [3]
- 9) SEO leads has almost 13% more rate than outbound leads (such as direct mail or print advertising [2,3]
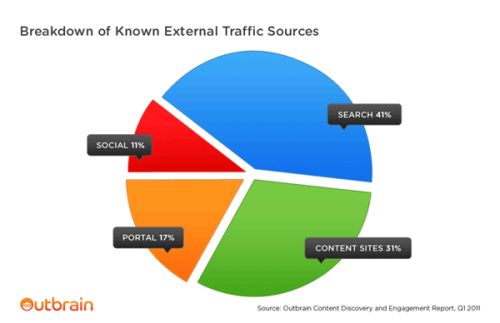
- 10) Search is the number one source of external traffic for content sites, beating social media by more than 300% [15]
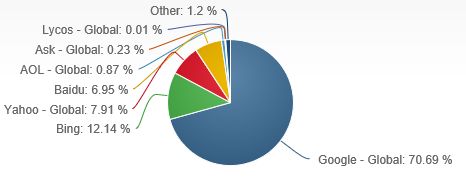
- 11) Google own 70% of the search engine market share (desktop) [4]
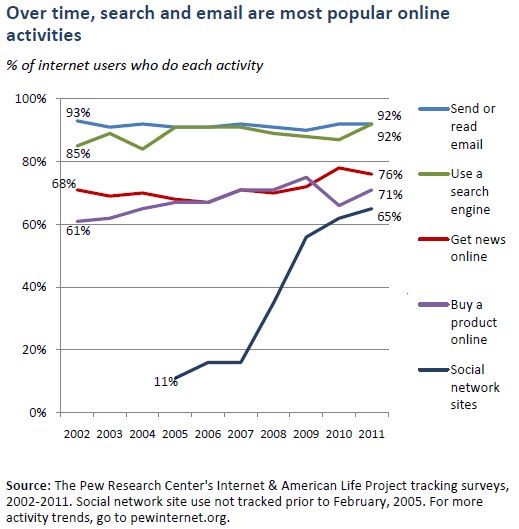
- 12) email and search have been the most popular internet activities since back to 2002 [7]
Living on the edge
Now you understand the importance of been on google top search results. if 3 top results are getting more than 60% clicks, 40% clicks are for all the rest! the best would be, focusing on long tail keywords without much competition while trying to be places 1-3 on them. You better have many small long tailed and not few heavy seed keywords. think what could happen if your primary traffic source are seed words ,and one day your competitors blow you off and you’re no longer at top places. With many long tailed keywords , you’re are more safe and less likely you’ll be down for all of them.
Targeting By Interest and Intent
We all know how important is to make effective keyword research. With Interest and Intent keywords, you have more changes attracting the correct targeted visitors and audience. The idea is to find the most converting keywords and maximize the usage of them.
The process composed from 3 parts:
1. Creating a list of seed words and starting terms
2. Expanding your list using keyword research tools
3. Refining the list by doing competitive research
Where to find the best conversion rate words (in both paid and natural search):
• Brand terms
• Product terms- what your product is or does and what problems it solves.
• Competitor terms
• Substitute and product name variation terms
• Complementary product terms.
• Audience terms- what people in your target audience might be searching for
How to do Keyword Research the Smart Way: Targeting Interest Intent
5 Popular Paid Services To Get Traffic Fast
TOP
Headlines
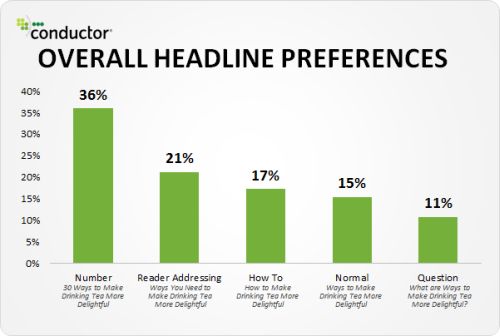
- 1) Headlines with numbers came at place one of users preferences with 36% [5]
- 2) A title with eight words performed best. These titles received a 21% higher click-through rate than average [6]
- 3) Data analysis by Outbrain’s showed readers are more attracted to content with images. Thumbnails increased click through rates by 27% and were better than logos [6]
- 4) Headlines contained odd numbers had a 20% higher click-through rate than headlines with even numbers [6]
- 5) Title with A colon or hyphen to mark subtitle, performed 9% better than headlines without [6]
- 6) 80% of readers never make it past the headline, this means only 2 out of 10 will read the rest [5]
- 7) Traffic can vary by as much as 500% based on the headline [5]
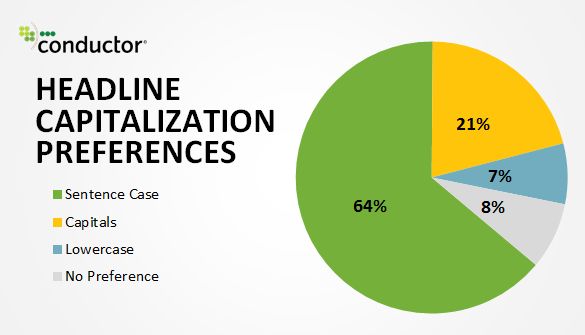
- 8) For headlines, 64% of people preferred sentence case capitalization [5]
- 9) Use title with no more than 9 words. Most adults can store between 5 and 9 items in their short-term memory [10]
- 10) With headlines write “7” instead of Seven. People find it easier to recall numbers rather than letters [10]
Tips on How to make killer headlines
• Add power words like: eye opening, amazing, happy, grateful, hope ,etc.
• Use numbers, now you know why!
• Use words like: what, why, how, when.
• Use unique rationale, like: ways, Tricks, Facts, Ideas, etc.
• Places to Search ideas for your titles: Quora, google autocomplete, Google Trends, ubersuggest.
• Suggest the best way to do something.
• Use color to grab attention.
• Make use of positive and negative superlatives that express emotions
• Take advantage of the Title statistics above.
33 Easy Ways To Write A Headline That Will Make You Successful
The Step-by-Step Guide to Writing Powerful Headlines
TOP
Social
- 1) Google+ is the highest correlated social factor for SEO ranking [1,24]
- 2) 93% of the most engaging posts on Facebook are with photos [12]
- 3) Facebook Photo posts receive 53% more likes than what average post gets[13]
- 4) Photo posts on Facebook attract 104% more comments and see 120 % more engagement than other posts [13]
- 5) Photo posts on Facebook get 84% more click-throughs on links than text-based posts [12]
- 6) Posts below 250 characters get 60% more engagement than others and 66% if less than 60 characters [12]
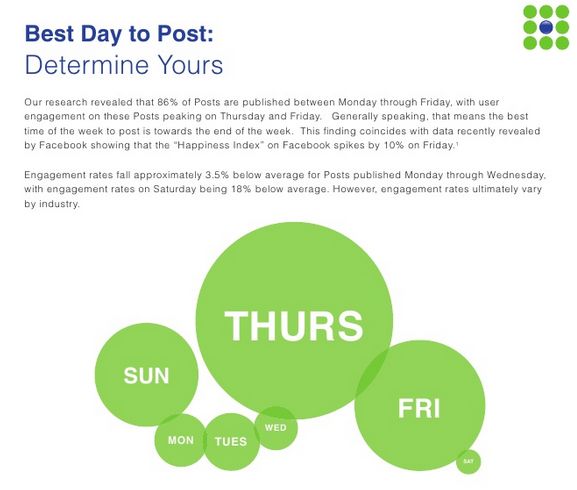
- 7) Best Facebook engagement days are Thursdays and Fridays with 18% higher rates [12]
- 8) Posts with emoticons get 33% more comments, they also get shared 33% more often [12]
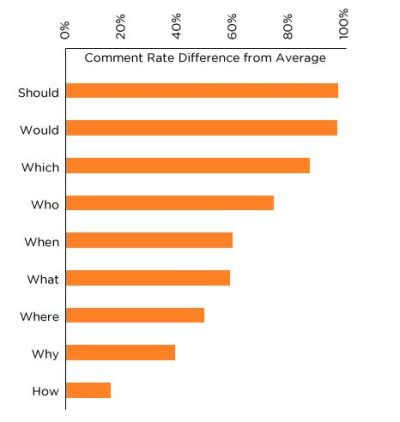
- 9) Question posts get 100% more comments [13,14]
- 10) Some questions types get more comments: “should”, would” and “which” are the most [14]
The following 5 statistics came from analyzing data from 1 million most shared articles from the top 190 media network:
- 11) 81.9% of shares were on Facebook [20]
- 12) 8.6% of shares were on Twitter [20]
- 13) 4.3% of shares were on Google+ [20]
- 14) 3.0% of shares were on Pinterest [20]
- 15) 2.2% of shares were on LinkedIn [20]
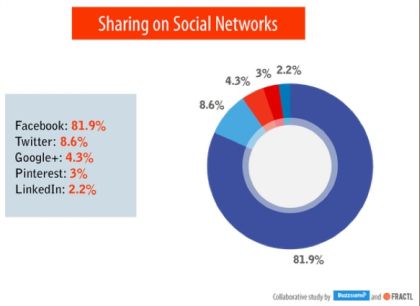
- 16) Facebook had 81.9% of all the shares in the study, over 4 times the amount of all the other networks combined [20]
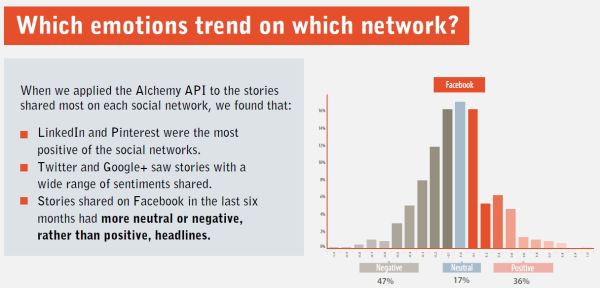
- 17) Content marketing sentiment varies by social media platform, Twitter and Google+ [20]
- 18) Twitter and Google+ revealed the most balanced range of sentiments in their 500 most shared articles [20]
- 19) The top 10 performing articles covered a range of emotions, so add surprise and curiosity into your headlines [20]
- 20) Among Internet users, Pinterest is now more popular than Twitter 21% Vs. 18% [23]
- 21) Women are four times more likely to be Pinterest users than men [23]
- 22) 45% of Internet users aged more than 65 are using Facebook [23]
- 23) Over 50% of Internet users either don’t use any social networks, or use just one [23]
- 24) 23% of Internet users aged 50+ use Pinterest [23]
- 25) Around 60% of Facebook and Instagram users sign in every day (only 46% of Twitter users) [23]
- 26) There is a 50% crossover between Instagrammers and Twitter network. Instagrammers also use Twitter [23]
- 27) Pinterest and LinkedIn are stand-alone networks (much less crossover usage with other networks) [23]
- 28) Pinterest and LinkedIn users are wealthier than the other networks [23]
- 29) 35% of Facebook fans made like to Facebook pages in order to compete in contests. good words to engage users contest are: winner, win, entry, contest, enter and promotion [12]
Social media best practices
• Work on visual elements like images and emoticons
• Create better titles for you posts
• Post multiple times to increase exposure
• Ask other questions and engage others
• Share on the right platform
• Analyze Past Content to Improve Posts
• Use Hashtags for your posts
• Use Social Updates to Write Blog Posts
• Automate your Curated Content
• Use Social Ads to get Targeted Website Visitors
TOP
Mobile
- 1) Mobile digital media time in the US is now significantly higher at 51% compared to desktop (42%) [8]
- 2) In 2015 mobile ad spending accounts for 49% of digital ad spending, which is only slightly behind the trends of how people are using their devices [8]
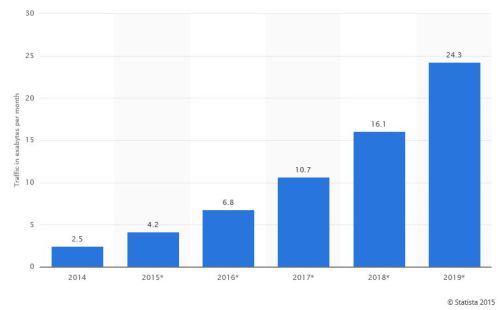
- 3) Projected Global mobile data traffic from 2015 to 2019 shows grow of almost x6 [9]
- 4) 70% of mobile searches lead to action on website within 1 hour [21]
- 5) How do people search on mobile devices? 40% of people are using tablet for their searches ,60% use their phone [21]
- 6) 40% of people will choose another result if it is not mobile friendly [21]
- 7) 45% of users in ages 18-29 use mobile for daily searches [21]
- 8) 40% of searches are conducted while users are watching television [21]
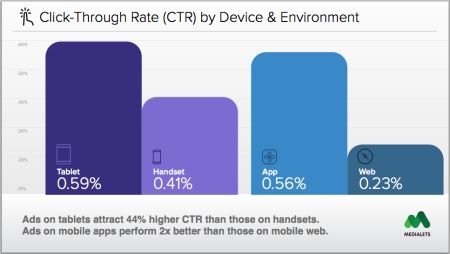
- 9) Ads on apps get much higher click-through than ads on the mobile Web: 0.59% on apps vs. only 0.23% on the mobile Web [22]
- 10) only a third of people watching a video ad will finish it, so call to action better come first, not last [22]
- 11) Half of YouTube views are on mobile devices [30]
- 12) One-third of all web pages are now served to mobile phones with 39% more global web traffic compare to 2014 [31]
Your mobile speed
As the statistics shows, mobile devices are getting more and more usage, and this trend is only expected to increase. Making a mobile friendly website, is something you should be ready for. To see how well your site perform, check it with google pagespeed, mobile tab. (better to check desktop as well) it can detect problems such as: browser caching, Html/ Css / JavaScript minify, Non Optimized images, not using compression, render-blocking and more. For wordpress users, there are many good plugin that are optimizing for speed, make sure you have cache plugin install- worpress plugins for seo.
You don’t need mobile devices in hand, in order to check for mobile responsiveness and functionality. There are free websites with mobile device emulators, such as ipadpeek and mobilephoneemulator, they enable testing of website mobile-friendly on multiple smartphone and tablet platforms. They will visually show you how it may look and where are the issues to fix.
TOP
Optimal Lengths
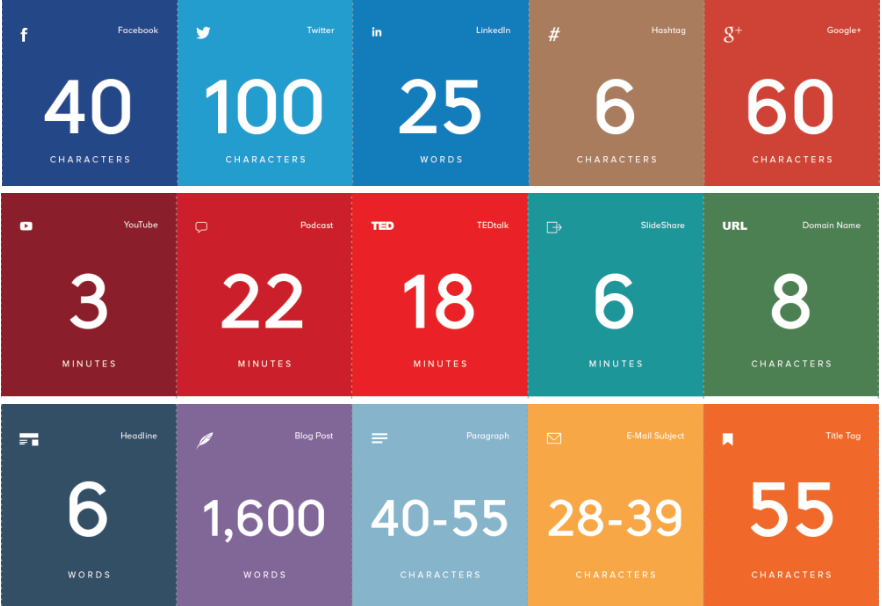
- 1) The optimal length of a tweet is 71 to 100 characters [11]
- 2) The optimal length of a Facebook post is 40 characters [11]
- 3) The optimal length of a Google+ headline is 60 characters maximum [11]
- 4) The optimal width of a paragraph is 40 to 55 characters [11]
- 5) The optimal length of a domain name is 8 characters [11]
- 6) The optimal length of a hashtag is 6 characters [11]
- 7) The optimal length of an email subject line is 28 to 39 characters [11]
- 8) The optimal length of an SEO title tag is 55 characters [11]
- 9) The optimal length of a LinkedIn post is 25 words [11]
- 10) The optimal length of a blogpost is 1,600 words [11]
- 11) The optimal length of a YouTube video is 3 minutes [11]
- 12) The optimal length of a podcast is 22 minutes [11]
- 13) The optimal length of a presentation is 18 minutes [11]
- 14) The optimal length of a Slide Share is 61 slides [11]
- 15) The optimal size of a Pinterest image is 735px by 1102px [11]
Focus on the important things
The most important, is focusing on what your write, and less if it has the exact length. If choosing between twitter tweet length and adding hashtag, I would pick the latest. Having the correct content has greater meaning to me, than tweaking the number of charters.
But, if you can keep with the statistics, it would be the best.
Advantages of using hashtags for social media
• Increase of your social reach and improve brand awareness
• Reach more easily targeted audience and customers
• Take advantage from riding on trending hashtags
• Deliver tips or facts related to your industry
• Can help business to track the success of their marketing strategy
• Same hashtag can be used across multiple social platforms
TOP
Other Data
- 1) Almost 42% of the world’s population has access to the internet as of January 2015. that’s 7% more than in 2014 [31]
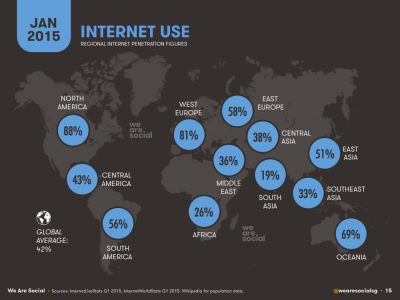
- 2) Users spends around 4 hours and 25 minutes using the net each day, with Southeast Asians at the highest average daily usage [31]
- 3) The United Kingdom leads in terms of active e-commerce use and Online Shopping, With 64% bought something online in the past month. Germany and South Korea follow close behind at 63% and 62% respectively, while the USA comes in fourth at 56% [31]
- 4) 29% of leading marketers are reusing and repurposing their content systematically [32]
- 5) 80% of B2B marketers have a content marketing strategy. (32% documented, 48% not documented) [32]
- 6) Top 3 things that make content effective: Audience Relevance (58%); Engaging and Compelling Storytelling (57%); Triggers a Response/Action (54%) [32]
- 7) 48% of marketers support 3 to 5 buying stages with dedicated content [32]
- 8) 88% of B2B marketers in North America use content marketing [32]
- 9) 51% of B2B marketers indicate that they will increase their content marketing spending in the next 12 months [32]
- 10) 56% of leading business bloggers are hiring additional resources in the next 12 months [32]
- 11) 38% of marketers publish content weekly or more often [32]
- 12) 53% of all bloggers are publishing at least weekly [32]
Wrapping up
It is good when you know, but even better, when you have facts. Relay on studies and not on feelings to strength your point.
If you have website, look at each of these statistics and see how you can maximize things. It can help you to focus on the major impacts coming from reliable data. If you’re marketer, use it for your work, customers, posts and finding gems between these lines.
I plan to use this is as reference to my next posts, as well for answers I give to others.Bye, till next time!
References
[1] 6 Sticky SEO Facts All Marketers Should Know (2014)[2] 93% of online experiences begin with a search engine (2014)
[3] 8 SEO Stats That Are Hard to Ignore (?)
[4] Desktop Search Engine Market Share (2015)
[5] 5 Data Insights into the Headlines Readers Click (2013)
[6] 5 Tips to Improve Your Headline Click-through Rate (2011)
[7] Top Internet Activities? Search & Email, Once Again (2011)
[8] Mobile Marketing Statistics 2015 (2015)
[9] Statistics and facts on mobile internet usage (2015)
[10] Short Term Memory (2009)
[11] Infographic: The Optimal Length for Every Social Media Update and More (2014)
[12] 7 Powerful Facebook Statistics You Should Know for a More Engaging Facebook Page (2013)
[13] Infographic: Photo posts get 120% more engagement on Facebook (2013)
[14] New Facebook Data Shows How Questions Impact Comments, Shares & Likes [INFOGRAPHIC] (2012)
[15] Search Sends More & Better Traffic To Content Sites Than Social Media, Study Says (2011)
[16] A Visual Guide to Keyword Targeting and On-Page SEO (2013)
[17] Does SEO Copywriting Still Matter? (?)
[18] Illustrating the Long Tail (2009)
[19] Survey: 90% Of Customers Say Buying Decisions Are Influenced By Online Reviews (2013)
[20] How To Improve Your Content Based On 2.6 Billion Social Media Shares (2014)
[21] Mobile Behavior: Big Game Seating — A Study with SurveyMonkey (2013)
[22] 10 Useful Social Networking Statistics for 2014 (2014)
[23] Study: Mobile Ads Actually Do Work – Especially In Apps (2014)
[24] Amazing Correlation Between Google +1s and Higher Search Rankings (2013)
[25] This Season’s Fall Reading SEO Survival Guide 2014 Ranking Factors Study (2014)
[26] The Definitive Guide To Ecommerce Search Engine Optimization (2015)
[27] No. 1 Position in Google Gets 33% of Search Traffic (2013)
[28] How Important is Content Length? Why Data-Driven SEO Trumps Guru Opinions (2012)
[29] How Content Length Affects Rankings and Conversions (2012)
[30] YouTube is the Second Largest Search Engine [Infographic] (2015)
[31] Digital, Social & Mobile Worldwide in 2015 (2015)
[32] Content Marketing Statistics: The Ultimate List (2015)
Oh wow, that’s a lot of information! I have to admit that my eyes glazed over some of the statistics but I did find the “Optimal Length” section really informative. I thought the ideal length for a blog-post is more than 3,000 words but I guess that’s not correct. I like writing longer pieces but this made me realize that I can cut back on length a bit, as long as the value remains the same. Thanks for compiling this information, it was really an eye-opener!
Hi Timothy,
Thank you for your nice words, yes it’s long and more as reference list.
The optimal Lengths section (10), refers to length from user point of view.
I quote from buffer:
“What makes this length optimal? At this length, you can expect readers to spend the maximum amount of time reading your content”
“1,600 words makes for a good guideline to get started.”…”We’ve found that 2,500-word posts tend to do best for us”
While this might be true, take a look at the SEO section for (8,10)
Google’s top 10 results, has average content length of at least 2,000 words.
so, I would try to keep with this and prefer the long one as you did before 🙂
James
Hi James,
I enjoying this big facts sheet for the marketers, this in-depth article is very useful for newbies.
I’ve gained lots of information and tactics from this article.
Thanks for sharing!
Hey, man, your post carries a lot of great information to help get better at marketing. Thanks for sharing it. It’s long and very useful.